An “LOL Chart” is a pair of bar graphs that shows how energy is changing in a system.
(It’s called “LOL Chart” because the chart outline looks like LOL letters.)
The charts compare energy at two points in time, which we call “Position A” and “Position B.”
Example 1: Draw an LOL chart for this scenario.
- At position A, a ball at height = 0 is moving upward quickly.
- At position B, the ball is more than half way up to its maximum height, but it is still moving upward.
Here’s what an LOL chart could look like:
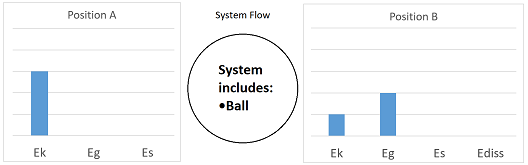
Things to notice:
- Position A only has kinetic energy (Ek).
No gravitational potential at Position A since height = 0. - Position B has a combination of kinetic and gravitational energy.
Ball is further up (gravitational) but is still moving (kinetic) - Both sides have the same amount of energy.
LOL Charts are Qualitative
Qualitative means the numbers aren’t exact. I decided to make the first kinetic energy bar 3 units high, but you could pick a different number instead and it would still be correct, as long as…
Bars add up to the same total for each position
I made both sides add up to 3 units of energy. This shows the conservation of energy: no energy was created or destroyed.
3 kinetic energy = 2 gravitational energy + 1 kinetic energy
What’s a “System?”
When we talk about energy changes, we need to decide what objects are part of the system we’re looking at.
A system can gain or lose energy from its surroundings. When that happens, we can draw energy units entering or leaving the system in that middle circle.
Example 2:
- At position A, a box is sliding horizontally at a fast speed.
- At position B, the box is still sliding sideways, but it’s going slower due to friction.
- The system includes the box, but not the floor.
Now the block will have less energy at position B than it had at position A. We will show that energy leaving the system.
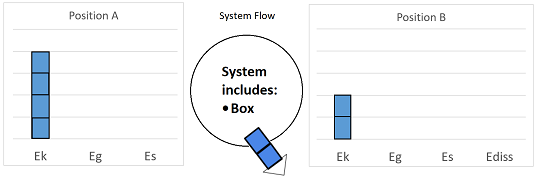
Things to notice:
- The lost energy (2 units) plus the remaining energy (2 units) adds up to the starting energy (4 units).
Example 3: Same as 2 except the building, the air, and the rest of the earth are included in the system.
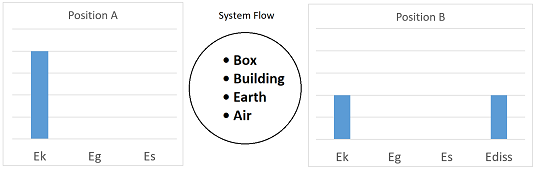
Some of the kinetic energy has been dissipated.
Here’s where that kinetic energy went:
- Speed up some air molecules: this includes making sound waves, heating up the air a tiny bit, and causing a slight breeze as air moves out of the way of the box.
- Heat up the floor a bit: friction has caused the floor to warm up a tiny bit
- Move the building and the earth: some of the box’s energy has been converted to kinetic energy of the building and the earth it rests on. It’s only enough energy to cause a tiny, tiny, tiny bit of acceleration, but that’s where some of the energy goes.
- The box warms up a tiny bit due to friction. Its molecules are wiggling in place faster than before.
All of these things increase the internal energy of the earth, the building, the air, and the box. The energy is still there, but not all of it is in the form of kinetic energy of the box.
In some textbooks and websites, you will see Internal Energy instead of Dissipated Energy. They mean the same thing.