Khan Academy Video + Practice: Proportional Relationships
Word Descriptions of Proportional Relationships:
- As one variable is multiplied by a number, the other variable is multiplied by the same number.
- If you divide one variable by the other variable for each line in the data table, it always equals the same amount.
Examples of Proportional Relationships
- Mass in kg is proportional to Weight in Newtons. The weight in Newton is always approximately 10 times as much as the mass in kg (in earth gravity).
- Age in months is proportional to age in years. Your age in months is always 12 times as much as your age in years.
- Volume of water is proportional to mass of water. If you triple the amount of water volume, the mass of the water is also tripled. If you graphed this relationship, the slope of your line would equal the density of water.
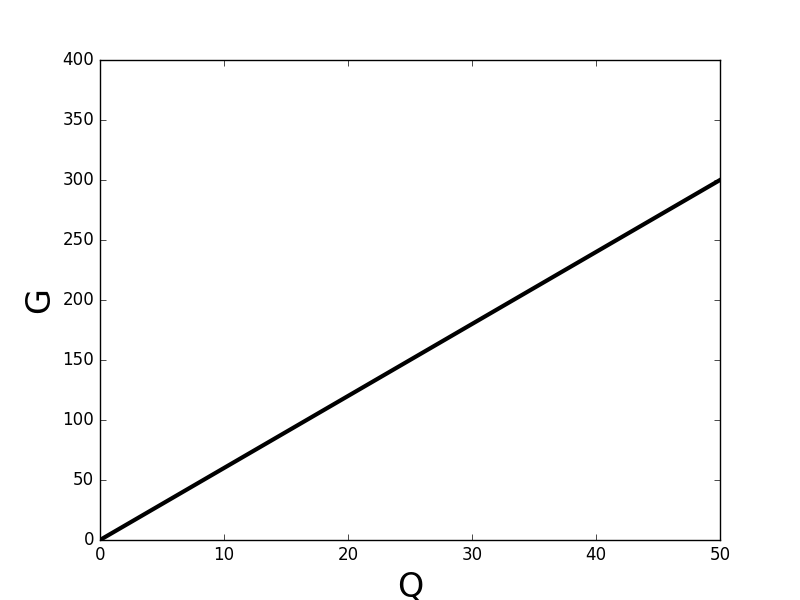
Graph Example
- Proportional graphs are straight lines (constant slope)
- The line must go through the origin (0,0)
- This also means that the y intercept is zero
Proportional Equations
Proportional equations follow the pattern of a line equation:
y = mx + b
y = variable on vertical axis
x = variable on horizontal axis
m = slope of line
b = y intercept (zero for proportional relationships)
Since y intercept is zero, proportional relationships actually must follow a simpler version of the line equation:
y = mx
Since y and x are on opposite sides of the equation, and neither of them is squared, and neither of them is on the bottom of the equation, we can say that y is proportional to x. This is how you can recognize a proportional relationship from looking only at an equation.
For example, Newton’s 2nd Law of Motion is F = ma.
F is proportional to a in this equation since they are on different sides of the equation, neither is raised to a power, and neither is inverse (that is, neither is in the denominator of a fraction). If you graphed Force versus acceleration, it would make a straight line with a slope equal to mass (m).
The example graph shown above has the following equation:
G = 6Q
The slope of the line (rise / run) is 6 for that example.
Data Example
The data in the table below is proportional, and it fits the graph and equation shown above. It uses made up variable names (G and Q) to show that the variables will not always be called “x” and “y.”
| Q | G |
| 5 | 30 |
| 10 | 60 |
| 50 | 300 |
Compare the first two pairs of numbers:
Q increases from 5 to 10 (it is multiplied by 2). At the same time, G increases from 30 to 60 (G is also multiplied by 2).
When both variables multiply by the same amount, that shows a proportional relationship.
Compare the last two sets of numbers:
Q increases from 10 to 50 (multiplies by 5) while G increases from 60 to 300 (also multiplies by 5).
Also, we can divide each pair of numbers, and we always get the same result:
| Q | G | G/Q |
| 5 | 30 | 6 |
| 10 | 60 | 6 |
| 50 | 300 | 6 |
Notice that the ratio G / Q is always equal to 6 for this data – this is a strong clue that the data is proportional.
Proportional Predictions
You can use proportional examples to make predictions.
Example:
G and Q are proportionally related. In one scenario, G is 15. In another scenario, Q is four times as much as it was in the first scenario. What is the second value of G?
Solution: if Q is multiplied by 4, then G will also be multiplied by 4. Multiply the original value of G by 4.
15 x 4 = 60
Since we don’t have an actual numeric value of G, we have to understand how proportional relationships work (both numbers multiplying or dividing by the same number) to solve it.
Example 2: A mystery liquid’s volume and mass are proportional., and two containers are full of this mystery liquid. Container 1 has a mass of 24 kg. Container 2 has one sixth as much volume as container 1. What is the mass of Container 2?
Solution: container 2 will have 1/6 as much mass as container 1.
24 kg x (1/6) = 4 kg.
OR, you could say that we’ve divided the volume by 6, so we also have to divide the mass by 6. This gives the same result.