These example graphs can help you describe the motion shown in position vs time graphs and velocity vs time graphs.
Note: Read the axis labels! It makes a big difference what type of a graph it is (position vs time, or velocity vs time).
Position vs Time Graphs
These graphs show how far an object is away from something that is defined as zero on the position scale.
In Applied Chemistry & Physics labs, the “something” at position=0 is often a motion sensor.
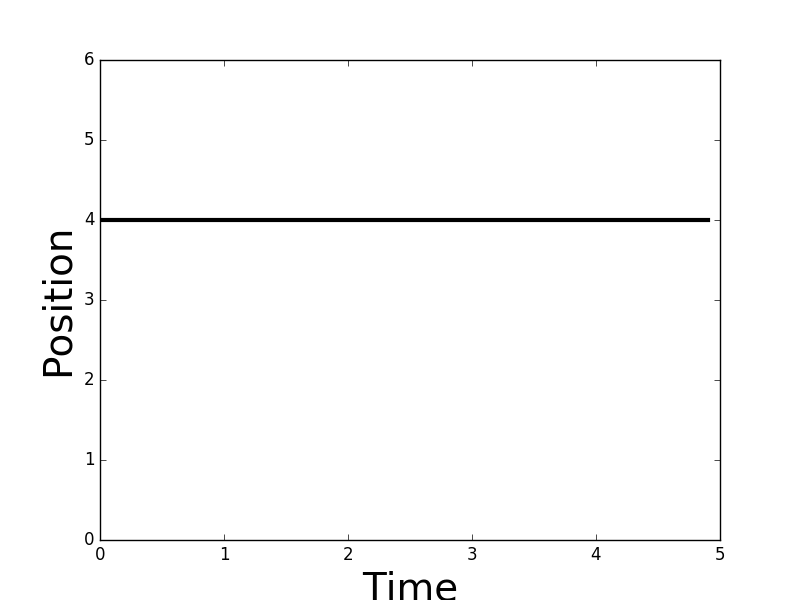
A graph with a straight, horizontal line shows no change in the variable on the vertical axis. In this case:
- Position is not changing
- Position is constant
- Object is not moving
- Slope is zero, so velocity is zero for this type of graph
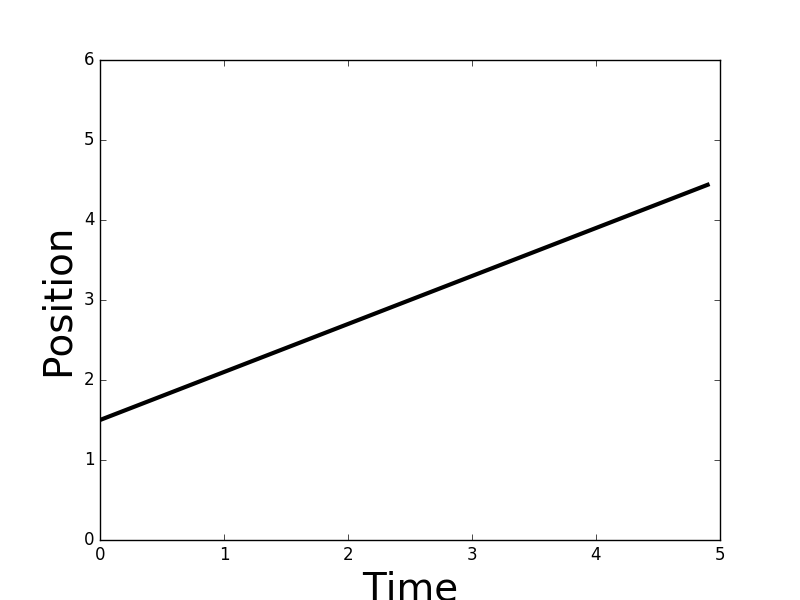
In this graph, position is increasing over time.
- Position is changing: object is moving away from whatever is at position zero.
- The amount of distance between zero and the object is increasing.
- Object velocity equals slope of the line
- The line has a positive slope: velocity is positive.
- Straight line means constant velocity (slope and velocity are not changing)
- Object is changing its position at a constant rate
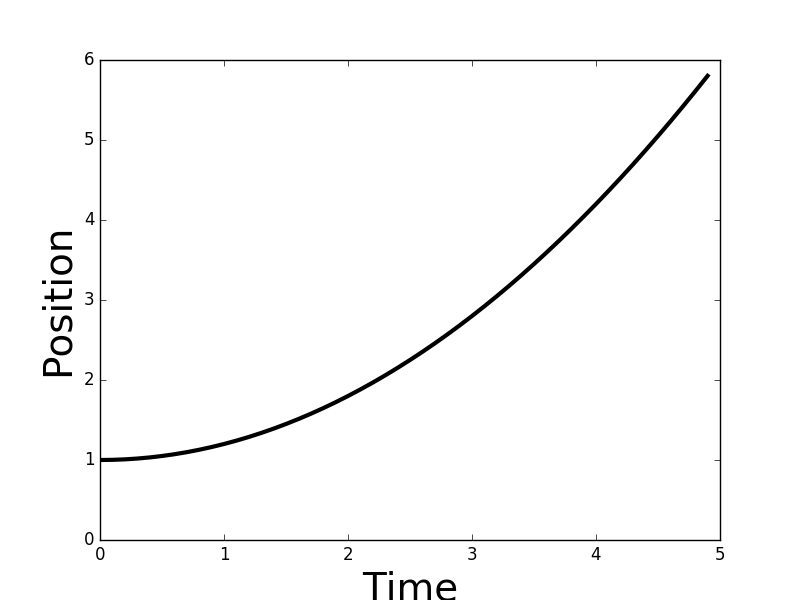
The upward curve in this graph shows that velocity is increasing.
- Slope is getting steeper as time passes, so velocity is increasing.
- The position is changing more at the end than at the start of the graph.
- At the very start of the graph, the slope appears to be horizontal for an instant. Therefore, the object starts with a zero velocity (not moving at the first instant).
- The object starts very slow and speeds up over time.
Velocity vs Time Graphs
These graphs show how fast an object is moving through time, not where it is located. However, you can still calculate an object’s location at any point in time if you happen to already know the object’s position at some point in time.
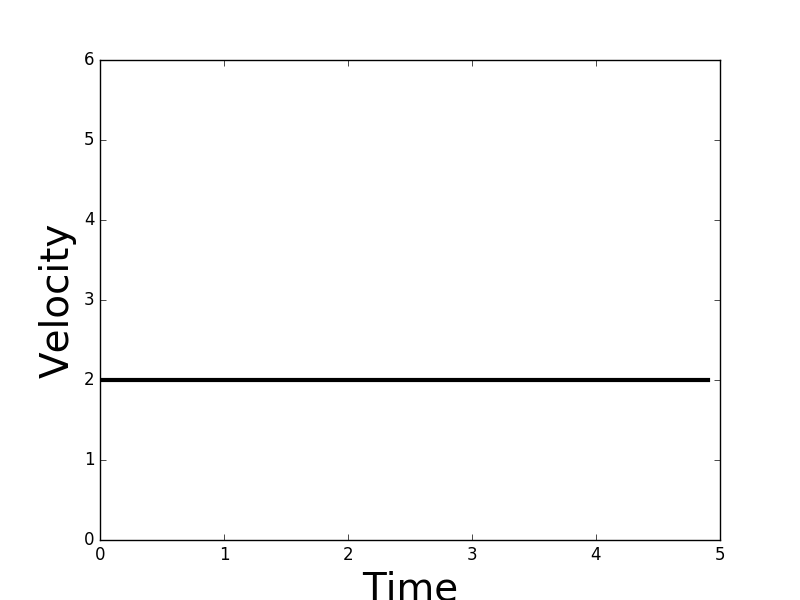
This is a straight horizontal line, so the variable on the vertical axis is constant (not changing).
- Velocity is not changing (constant velocity)
- The object is moving, because velocity is not zero
- Slope = 0
- Slope = acceleration, so acceleration = 0
- The object is changing position at a constant rate
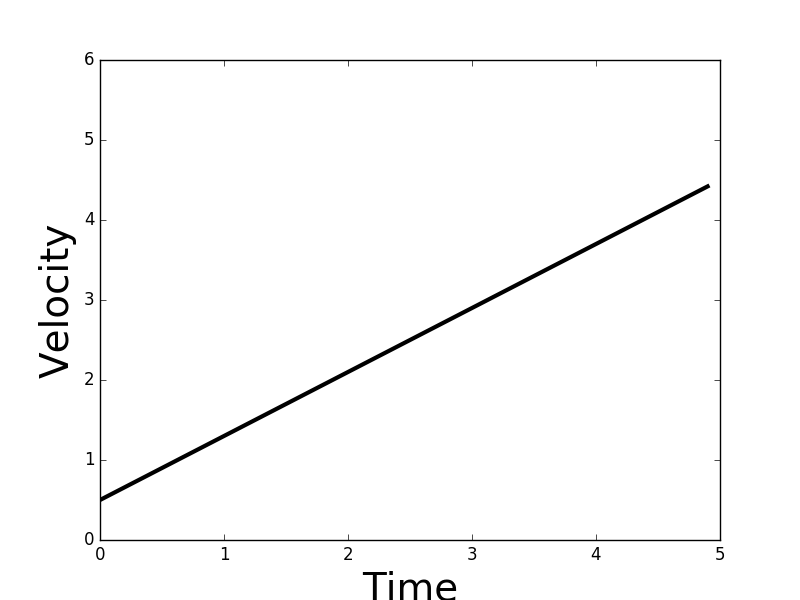
In this example, the velocity is changing (increasing).
- Slope = acceleration
- Straight line means slope is not changing, so acceleration is not changing
- Object is accelerating at a constant rate
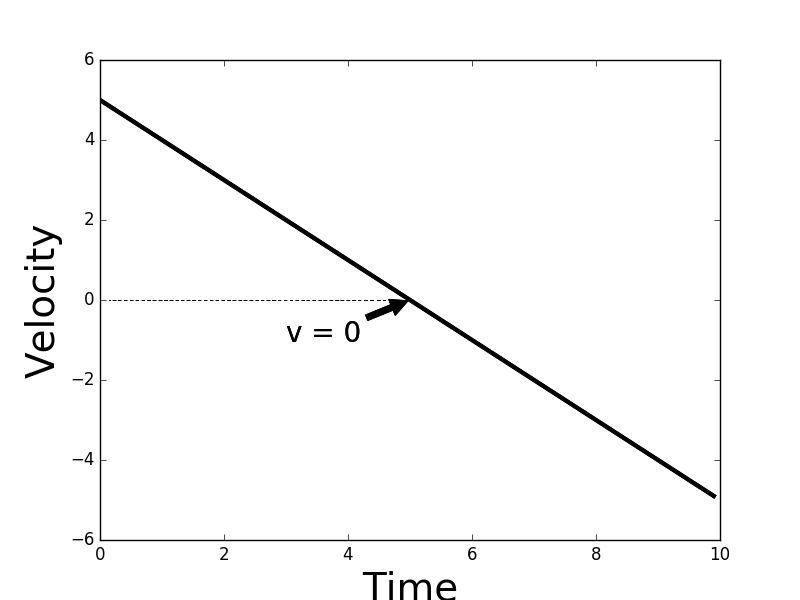
This example shows velocity decreasing at a constant rate.
- The line has a constant negative slope (straight line pointing down)
- Acceleration is not changing since slope is not changing
- Acceleration is negative since slope is negative
- Velocity descreases until v = 0, and it continues decreasing to make velocity more and more negative
- It’s important to notice where zero is on the velocity axis to see when the object is stopped
- Object is moving away from the zero position when velocity is positive (line above v = 0)
- Object is moving toward the zero position when velocity is negative (line below v = 0)