Suggestion: learn Proportional Relationships before this section.
Word Descriptions of Inverse Relationships:
- As one variable is multiplied by a number, the other variable is divided by the same number.
- The variables change in opposite directions. (Note: this is a true statement, but it is not sufficient to fully describe an inverse relationship, because many other types of relationships have the variables moving in opposite directions)
- If you multiply one variable by the other variable for each line in the data table, it always equals the same product.
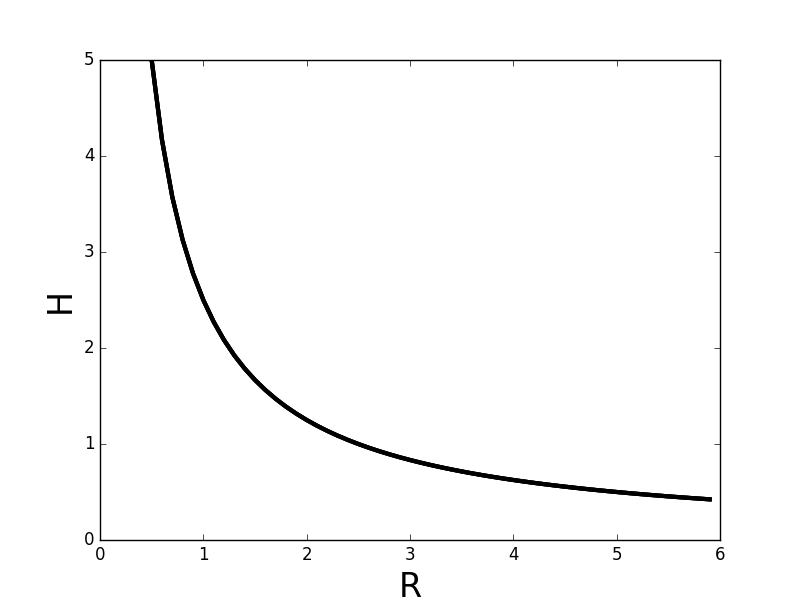
Graph Example
- Inverse equation graphs are curved lines
- The slope is negative (downward to the left) and changing
- The lines approach the x and y axes but never reach zero
The equation for this line is as follows (each equation is equivalent)


Inverse Relationship Equations
The equation of inverse relationships follows the form of this equation: (all three equations are the same, rearranged in different ways)


y = variable on vertical axis
x = variable on horizontal axis
c = constant = the product of the two variables
If two variables are multiplied together on the same side of the equation, they have an inverse relationship.
Or, if the variables are written on opposite sides of the equals sign, and one of them is in the denominator, this also means they have an inverse relationship.
Relevance to Newton’s 2nd Law:
in F = ma, The variables mass (m) and acceleration (a) are on the same side of the equation, multiplied together, so they are inversely related.
Newton’s 2nd Law can also be written in this way:

In this case, we see a on the top and m in the denominator on the other side of the equation, so that also shows an inverse relationship between acceleration (a) and mass (m).
Data Example
The data in the table below is inverse, and it fits the graph and equation shown above. It uses made up variable names (G and Q) to show that the variables will not always be called “x” and “y.”
| R | H |
| 0.5 | 5.0 |
| 1 | 2.5 |
| 2 | 1.25 |
| 2.5 | 1.0 |
| 5.0 | 0.5 |
Compare the first two pairs of numbers:
R increases from 0.5 to 1.0 (it is multiplied by 2). At the same time, H is divided by 2 (decreases from 5.0 to 2.5).
When one variable is multiplied by a number and that causes the other to be divided by that same number, that shows an inverse relationship.
Compare the last two pairs of numbers from the table:
R increases from 2.5 to 5.0 (multiplies by 2) while H decreases from 1.0 to 0.5 (divided by 2). Again they move in opposite directions, and they change by the same factor (2).
Also, we can multiply each pair of numbers, and we always get the same result:
| R | H | RH |
| 0.5 | 5.0 | 2.5 |
| 1 | 2.5 | 2.5 |
| 2 | 1.25 | 2.5 |
Notice that the product RH is always equal to 2.5 for this data – this is a strong clue that the data relationship is inverse. H is inversely related to R.